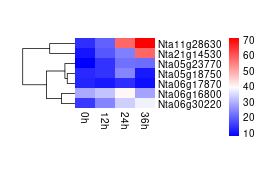
Download result picture
heatmap-nt.png (right click to save picture)
heatmap-nt-L.png (log2 transformed) (right click to save picture)
Database Description
GENE EXPRESSION PROFILING IN Nicotiana tabacum SR1 leaves. Data source: Zhang QL et. al. 2023,
Download Data table
heatmap-nb-data (right click to save data)
Data format: X#Y, X represents the average FPKM calculated from biological replicates, Y represents standard deviation, # is a data seperator